3.2. Cached Tiles
By default, the WMS layer makes requests for 256 x 256 (pixel) images to fill your map viewport and beyond. As you pan and zoom around your map, more requests for images go out to fill the areas you haven’t yet visited. While your browser will cache some requested images, a lot of processing work is typically required for the server to dynamically render images.
Since tiled layers (such as the WMS layer) make requests for images on a regular grid, it is possible for the server to cache these image requests and return the cached result next time you (or someone else) visits the same area - resulting in better performance all around.
3.2.1. OpenLayers.Layer.XYZ
The Web Map Service specification allows a lot of flexibility in terms of what a client can request. Without constraints, this makes caching difficult or impossible in practice.
At the opposite extreme, a service might offer tiles only at a fixed set of zoom levels and only for a regular grid. These can be generalized as XYZ layers - you can consider X and Y to indicate the column and row of the grid and Z to represent the zoom level.
3.2.2. OpenLayers.Layer.OSM
The OpenStreetMap (OSM) project is an effort to collect and make freely available map data for the world. OSM provides a few different renderings of their data as cached tile sets. These renderings conform to the basic XYZ grid arrangement and can be used in an OpenLayers map. The OpenLayers.Layer.OSM constructor accesses OpenStreetMap tiles.
Tasks
Open the
map.htmlfile from the previous section in a text editor and change the map initialization code to look like the following:<script> var center = new OpenLayers.LonLat(2.825, 41.985).transform( 'EPSG:4326', 'EPSG:3857' ); var map = new OpenLayers.Map("map-id", {projection: 'EPSG:3857'}); var osm = new OpenLayers.Layer.OSM(); map.addLayer(osm); map.setCenter(center, 16); </script>
In the
<head>of the same document, add a few style declarations for the layer attribution.<style> #map-id { width: 512px; height: 256px; } .olControlAttribution { font-size: 10px; bottom: 5px; left: 5px; } </style>
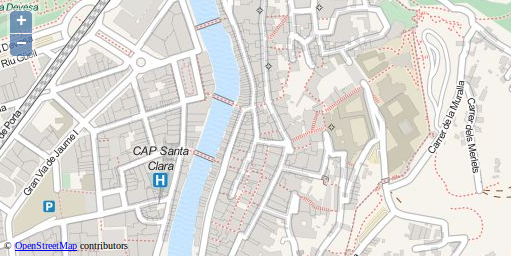
Save your changes, and refresh the page in your browser: http://localhost:8082/ol_workshop/map.html
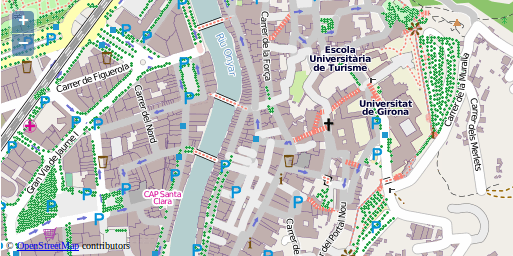
A map with an OpenStreetMap layer.
3.2.2.1. A Closer Look
3.2.2.1.1. Projections
Review the first 3 lines of the initialization script:
var center = new OpenLayers.LonLat(2.825, 41.985).transform(
    'EPSG:4326', 'EPSG:3857'
);
Geospatial data can come in any number of coordinate reference systems. One data set might use geographic coordinates (longitude and latitude) in degrees, and another might have coordinates in a local projection with units in meters. A full discussion of coordinate reference systems is beyond the scope of this module, but it is important to understand the basic concept.
OpenLayers needs to know the coordinate system for your data. Internally, this
is represented with an OpenLayers.Projection object. The transform function also takes strings that represent the coordinate reference system ("EPSG:4326" and "EPSG:3857" above).
3.2.2.1.2. Locations Transformed
The OpenStreetMap tiles that we will be using are in a Mercator projection. Because of this, we need to set the initial center using Mercator coordinates. Since it is relatively easy to find out the coordinates for a place of interest in geographic coordinates, we use the transform method to turn geographic coordinates ("EPSG:4326") into Mercator coordinates ("EPSG:3857").
3.2.2.1.3. Custom Map Options
var map = new OpenLayers.Map("map-id", {projection: 'EPSG:3857'});
In the previous example we used the default options for our map. In this example, we set a custom map projection.
Note
The projections we used here are the only projections that OpenLayers knows
about. For other projections, the map options need to contain two more
properties: maxExtent and units. This information can be looked up
at http://spatialreference.org/, using the EPSG code.
3.2.2.1.4. Layer Creation and Map Location
var osm = new OpenLayers.Layer.OSM();
map.addLayer(osm);
As before, we create a layer and add it to our map. This time, we accept all the default options for the layer.
map.setCenter(center, 9);
Finally, we give our map a center (in Mercator coordinates) and set the zoom level to 9.
3.2.2.1.5. Style
.olControlAttribution {
    font-size: 10px;
    bottom: 5px;
    left: 5px;
}
A treatment of map controls is also outside the scope of this module, but these style declarations give you a sneak preview. By default, an OpenLayers.Control.Attribution control is added to all maps. This lets layers display attribution information in the map viewport. The declarations above alter the style of this attribution for our map (notice the small Copyright line at the bottom left of the map).
Having mastered layers with publicly available cached tile sets, let’s move on to working with proprietary layers.
3.2.2.1.6. Bonus exercise
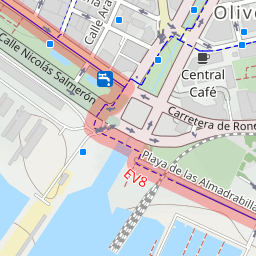
- Review the OSM layer API documentation to how to load other OSM layers
- Modify your layer initialization accordingly
A map with an OpenStreetMap based MapQuest layer.
Hint
You can go to the official OSM site to view the layers available, change to any of them and use the browser tools to look for the url pattern of those tiles.
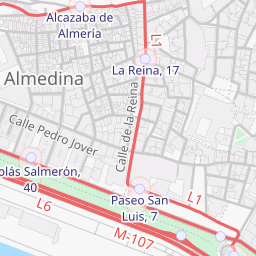
Here you have some different renderings of OSM, extract the template URL and try to create your own custom OSM map:
- OSM Bicycle map: http://b.tile.thunderforest.com/cycle/16/32319/25546.png
- OSM Transport map: http://c.tile.thunderforest.com/transport/16/32318/25545.png
- Stamen watercolor map: http://d.tile.stamen.com/watercolor/15/16159/12773.jpg
- Stamen toner map: http://d.tile.stamen.com/toner/14/8079/6386.png
- Mapbox Saman Bemel random map: https://a.tiles.mapbox.com/v3/saman.h6ek9086/14/8080/6386.png
Warning
Those tiles are used here for educational purposes, check owner conditions before using them on your projects!!